Thursday, September 5, 2013

Programming Mobile Apps for Android With Eclipse

In my previous article titled: Mobile Software Programming: Designing & Building Mobile Apps (Android) I discuss the basic concepts associated with designing and building a mobile application or game for Android. This article provides insight into creating an Android app (whether a game or not game app). It discusses the core files and folders included in an Android app; and, it also discusses the Git tool, which can be used to download project files for the applications (i.e., camera, calendar, calculator, etc.) that come preinstalled on an Android device. If you are just getting started with Android programming this article will help you to follow the Building Your First App tutorial since it provides screen captures and some steps not outlined in the tutorial.

Getting Started


Before building an Android app you must download and install the Android SDK (the ADT Bundle includes the Eclipse IDE). Eclipse is the development platform used to write, run, test and deploy Android apps. When you initially install the SDK all of the tools are not automatically installed. Instead, you will need to relaunch the SDK Manager and select the additional tools that you want to install.

Note:  You will want to make sure you select Google Play Services if you want to build custom apps that will incorporate Google Maps, Google+, display ads from within your app, etc. and/or build games.


Once you install the Android Developer Tools (ADT) Bundle you can launch Eclipse to access the SDK Manager, shown above. From the Eclipse menu you can select Window -> Android SDK Manager (as shown below). When the Android SDK Manager displays simply click on the additional components you want installed.

Android Projects


The article titled Creating an Android Project does a good job of explaining how to create an Android project. There are several concepts you will encounter when working with an Android project. First, Eclipse will prompt you for a Workspace folder. Once you select a Workspace folder for your session (considering that each time you launch the IDE you are starting a session) Eclipse will store your project files in the Workspace folder. You can use a single Workspace for all projects. It's up to you. And, it largely depends on how you want to organize your projects.


If you plan to use a single Workspace, notice you are given the ability to check the "Use this as the default and do not ask again" checkbox so you do not need to specify a Workspace each time you access Eclipse.

Project Folders/Files


When you create a new Android App project Eclipse creates a new folder (in the Workspace folder) using the project name you specify. It adds the project folders and files required to support an Android application project. The following paragraphs provide a brief overview of the key folders/files that make up the Android app project:

.settings - This folder includes the PREFS file that defines Eclipse preferences for the compiler including target platform and compiler compliance that indicates the JDT (Java Development Tools) version  the source should conform to. Eclipse automatically sets these levels.

bin - Includes the project classes and the AndroidManifest.XML file required to run Android applications.


gen - The Gen folder includes the Java Language Source Files for the project. These files define the build configuration and application settings such as the theme settings, activity horizontal and vertical margins specified by the developer (through coding), buttons added to the application, etc.

libs - This folder includes the JAR file, which includes classes used by your application. The following picture shows the contents of the android-support-v4.jar file


res - This folder includes the resource files used by the application including the activity_main.xml file, which includes the layout and other settings for your app. It also includes the images used by your application along with other files.

src - This folder includes the Activity class that is executed when your application runs. For example, it includes theonCreateOptionsMenu(Menu menu) procedure that adds the items to your application's action bar, if it includes one.
 
.project - This file manages project related information such as project name, project description and other elements as shown in the following picture.


You can read more about project folders and files by reading the Managing Projects documentation at http://developer.android.com/tools/projects/index.html .

Running Your App On an Android Device


Once you complete the tutorial or build an application you will want to run it to make sure it works. If you have an Android device you can test your application on your device. However, to do so you must first set the developer options on your device. The Developer options window (shown below) is available from Settings. You must enable USB debugging. Doing this allows Eclipse to deploy your application to your device.


Once you have enabled USB debugging you can connect your device to your computer hosting your Android App development environment. (After I connected my device to my computer I set the USB Connection Type as Mass storage.) You can then select run from the Eclipse menu. Once Eclipse recognizes your device it appears as an option from the Android Device Choose window (invoked by selecting Run).


If you select your device and click OK, Eclipse will deploy your Android app to your device. For more information you can read the documentation titled Run On a Real Device. As shown in the following picture the custom Android App I deployed to my Android phone is called PVL Sample App. (In case you are wondering I do not play Candy Crush or color in the Coloring Book. My little one plays with them (o: )


Creating an Emulator for Your App


If you don't have an Android device don't fret. You can still join the Android development movement. The Eclipse environment provides a way for you to create an emulator to which you can deploy your apps. You can select Android Virtual Device Manager from the Window menu in Eclipse. The Android Virtual Device Manager will display (as shown below).


You can then create a New device. You need to select the type of device you want to create and define the settings for the device


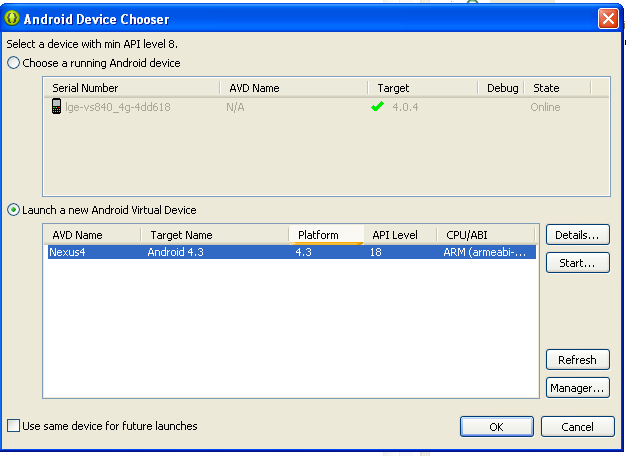
Once you create the device you can use the Android Device Chooser to Launch a new Android Virtual Device, as shown below.

The following picture shows the PVL Sample App deployed to a virtual tablet. You can then test the application's behavior to ensure it performs as it should.


Packages

Java classes are organized by Packages. Classes contain procedures that are used by importing the package (as shown in the picture below). A list of the Android packages and classes can be viewed at http://developer.android.com/reference/packages.html .


Android Training & Sample Apps


Google has posted trainings for individuals who want to learn Android app programming. The trainings are located at http://developer.android.com/training/index.html . It's best to follow the trainings in sequence if you are not an experienced Android app developer because the tutorials start with basic concepts and as the training progresses the concepts increase in complexity.

You can download and view core source project files associated with Android, which includes the project files for the camera, calendar, contacts and other apps on your Android device. To get the files you must first install the Git application. Git is available from the following location:  http://git-scm.com/downloads . Once you have downloaded and installed Git you can clone the Android repository that contains the project files (available from the following location: https://android.googlesource.com/ ).

The URL for the repository is used to direct Git to the repository you want to clone. The Clone Git Repository wizard allows you to select the releases and other options associated with cloning the repository.


You can then create a new project from existing code and tell Eclipse to "copy projects into workspace". The project is then added to the workspace and can be deployed to a real or virtual device for testing. A future post will  provide more insight on downloading, accessing and using Git repository files within Eclipse.

More About Git


The following resources pertain to working with the Android Open Source project . They provide great insight into Git. You will want to read Codelines, Branches, and Releases at  http://source.android.com/source/code-lines.html; and, you may also want to look at Codenames, Tags, and Build Numbers at http://source.android.com/source/build-numbers.html . The documentation on Developing is also a great resource:  http://source.android.com/source/developing.html . Lastly, a useful list of Git Resources is located at http://source.android.com/source/git-resources.html . The resource list includes a link to an online version of the published book  Pro Git for those seeking to gain expert-level Git skills.

Tuesday, August 27, 2013

Amazon Kindle Publishing for Books, Technical Manuals & Blogs

This article provides insight into publishing content for Amazon's Kindle Fire, Kindle Fire HD and other Kindle versions. The first part of the article discusses the KindleGen tool used to generate a digital book or manual for Kindle. The article also talks about the files that must be created so a book or technical manual can be published for Kindle users. And it provides an overview of Kindle Previewer, which is used to view a Kindle book or manual before it is publish for distribution. Lastly, it provides insight on how to make a Kindle version of a blog available for purchase from the Amazon Kindle store.

International Digital Publishing Forum (IDPF)


The IDPF is responsible for defining and managing the specifications adhered to by Kindle and other devices that provide a way for users to read electronic publications. You can learn more about IDPF by visiting http://idpf.org .

Getting Start With Kindle Publishing using KindleGen


There are a couple ways you can make your book or technical manual available for Kindle users. One way is to use KindleGen, which is a tool used to generate a file (.mobi) that Kindle can read. You can download KindleGen from the Amazon website. To begin you will need to click the "I agree to terms of use" to accept the terms of use and download KindleGen. Next you will need to click the "Download Now" button that corresponds to your computer's operating system (i.e., if you are running Windows XP, Vista or Windows 7 you would click the first Download Now button).

You will also want to download the sample files that are available (the arrow in the picture below is pointing to the link you must click to download the sample files). The sample files include useful examples that you can review to see the layout, navigation and other features of a Kindle publication.


Once you have downloaded the files you will need to unzip them to a desired location on your computer. It is useful to create a folder on your c:/ drive (if using windows) so you can easily find and access the files. If you download all of the files available, you will have a number of files to access. The following picture shows the zipped files and the folders created after I unzipped the files.


KindleGen


KindleGen is a command-line tool, which means you cannot access it's functionality by pointing and clicking a user interface. Instead you must type commands to access and use KindleGen. To use KindleGen, after I unzipped the files, I created a folder called KindleGen on my c:\ drive, as shown below. I then copied the kindlegen.exe file into this folder so I could access it more easily.


Since kindlegen.exe is a command-line tool you must use a Command window (if you are using a Windows operating system); or, the Terminal window (if you are using a Mac) to execute commands. When you are ready to compile your book or manual you will type:  kindlegen.exe press the Space key on the keyboard and then type the name of your .osf file (described below) and press the Enter key. This will execute the command to compile your book or manual.

The Files That Make Up Your Kindle Book or Manual


When you use kindlegen.exe to create a digital copy of your book; KindleGen will create a .mobi file. However, there are several files you will need to create to ensure you have a complete publication. If the publication will be sold on Amazon some of these files, discussed below, are required. (Amazon published a manual that outlines its publishing criteria for Kindle. Following is the link to the publication:  http://kindlegen.s3.amazonaws.com/AmazonKindlePublishingGuidelines.pdf )

You don't need a special tool to create the book you want to make available to Kindle users. Microsoft Word can be used not only to create your book; but also to create the front cover and back cover. When you save your document(s) using Word you can select web page filtered (as shown below). This option ensures your file only contains standard HTML elements.


Your book chapters can be created as either separate HTML files (a file for each chapter); or, a single file (all chapters in one file). If you create a single file you will need to add anchors (see HTML Hyperlinks for more information) to your document so your table of contents listings can link to the anchors.

The following list briefly discusses some of the files that will make up the digital version of your book or technical manual:

1. Cover - This is the page users see when they first access your product using Kindle Fire.


2. Book or Manual File(s) - This is your book or manual (excluding the front/back cover and the table of contents).


3. Navigation Document - The Navigation document (NCX file) is a logical table of contents. The NCX file (i.e., toc.ncx) is built using Extensible Markup Language (XML) standard concepts.  The .ncx file includes elements to define the text that should display in the table of contents and the link to the text.  Following is a picture of what the table of contents looks like using the Kindle Previewer (discussed later in this article):


 Below is the code used to build the table of contents shown above.


Notice, the <navPoint> element is used to define a single table of contents entry that includes the text to display and the page the user views when the text is clicked. The <navLabel> holds the <text> element, which defines the text to display in the table of contents. (Note that when you work with elements each opening element must have a closing element. For example, <text></text>.)

You may be wondering how Kindle knows Cover and cover.html belong together? It reads the information between the <navPoint> and </navPoint> elements as belonging together. Further, it knows Cover is the text to display because it is between the "text" elements. The "text" elements must be enclosed by the <navLabel> element. This means every line that must show up in the table of contents should be preceded by <navLabel><text> and followed by </text></navLabel>. Every link associated with the table of contents text must be preceded by <content> and followed by</content> (as shown in the above picture). The src property (of the <content> element) defines what page Kindle should jump to when the text is clicked. For example, when Cover is clicked Kindle should jump to the following source (src): cover.html. Lastly, the playOrder property associated with the <navPoint> element defines the order of the table of contents items. The id property provides a way to define a unique ID for each <navPoint> element since a file will usually have multiple navPoint elements.

5. Publication Header File - The Publication Header File (.opf file) includes information about the book or publication including the author name, publisher name, book title, etc. It also lists the files that make up the entire book (located between the <manifest> </manifest> elements). Following is a picture of an .opf file displayed using an XML editor, which makes it easier to create, read and edit the file. Notice it uses elements just as the .ncx file uses elements. Therefore, you would expect each element that is opened (in the .opf file) to have a matching closing element. Notice this file also includes the Spine element (after the <manifest> element).


4. Back Cover - The contents and picture that should display as the back of the book.

6. MOBI File - KindleGen uses the .opf file to generate a book or manual that includes all of the files listed between the <manifest> elements. The result is a .mobi file. (For example, my .opf file is called "business system analysis.opf". From the Command window I typed: kindlegen.exe "business system analysis.opf" and then pressed the Enter key to execute my command. KindleGen then created the Business Systems Analysis.mobi file, which I opened using the Kindle Previewer.)

If you want to learn more about creating a Kindle book and you own a Kindle; or, you use a mobile phone and have the Kindle app installed you can order the free book titled: Building Your Book for Kindle.

The Kindle Previewer


The Kindle Previewer provides a way to look at a book or manual to see how it will look when it is opened using Kindle. Kindle Previewer includes the options that allow you to browse through the pages of your book or manual. You can view your table of contents and make sure your product is properly formatted for the various Kindle versions.


You can even check out your front and back covers. If you are interested in learning more about the Kindle Previewer you can access the Kindle Previewer user's guide at the following location: http://kindlepreviewer.s3.amazonaws.com/UserGuide.pdf. (Note that you can download and install the Kindle Previewer from the same page from which you download KindleGen: http://www.amazon.com/gp/feature.html?ie=UTF8&docId=1000234621)

Amazon Kindle Samples


If you downloaded the samples when you downloaded KindleGen and Kindle Previewer you have great example files. You can open each of these samples to see the associated files and file structure (i.e., the images are placed in the image folder, etc.). You can use the Kindle Previewer to open the .mobi file in each sample to see how the navigation works and to see digital book looks like. And, you can use any HTML editor to open the HTML files. You can also create a copy of the .opf and the .ncx files and open them in an XML editor to see the contents of these files as well. Sometimes looking at examples can help clarify how things work.

Kindle Direct Publishing


If you want to avoid KindleGen you can still publish your book for Kindle users to access. If you use Kindle Direct Publishing (KDP) you not only provide readers an alternate way to access your book; but also you retain 70% of your royalties. And, KDP provides a way for you to view your book using an online viewer. You can use Microsoft Word to create your book; and, you can then upload it to the Kindle Direct Publishing site. If the book already exists, all you need to do is upload it. You can learn more about building your book for KDP by reading Amazon's Simplified Formatting Guide and access the Getting Started page.


Kindle Publishing for Blogs


Lastly, if you have a blog that contains useful information you can make your blog available to Kindle users who buy from the Kindle store. There are two key reasons a blogger would want to make a blog available on the Amazon Kindle store site: 1.Those who want to view blog content without an internet connection can do so; and, 2. Bloggers make money when customers download the Kindle version of the blog.


Kindle Publishing for Blogs also means customers receive the entire blog article, right to their device, as new articles are posted.


To get started you will need to create a Kindle Publishing account, if you don't already have one.  You will need to create a Masthead file, which is the image that will display as the banner when users access your blog using Kindle. You will also need a screenshot of your blog to display on your blog's Amazon page. And, you will need the RSS feeds URL for your blog. (If you use Blogger the feed URL can be accessed by going to the bottom of your blog's page and clicking: Subscribe to: Posts (Atom).)

To publish your blog for Kindle access you can visit the Kindle Publishing for Blogs site at https://kindlepublishing.amazon.com/gp/vendor/sign-in

Conclusion


Our society is busier than ever. And, some people want to avoid piling old books in the attic; while others want to access content sooner rather than later.  So, digital publishing may not be for everyone; but there are certainly quite a few who have found a niche in it.

Tuesday, August 20, 2013

Business Intelligence: Using Mining Structures, Models, Cubes & Dashboards

In a previous article I discussed the design of the data warehouse database. This is the first article in a series of articles that discuss ways to access and use data warehouse data to achieve corporate goals. Topics discussed in this article include mining structures and models, cubes, scorecards and dashboards.

I remember when I was first exposed to SQL Analysis Services. That was when it was launched for SQL Server 2000. Business Intelligence (BI) has come a very long way since then; and, Microsoft has (over the years) continuously updated its suite of BI tools. With SQL Server 2000 Analysis Services accessing data warehouse information took more effort and provided less options than today.

Today BI developers can use the Business Intelligence Development Studio or Visual Studio 2010 (or higher) to build mining structures and models that help sales and marketing teams launch more effective strategies to sell products or services. And, let's face it, nearly every company has a product or service it wants to sell. And, most want marketing to be more efficient and effective in this sluggish economy. What BI can do is answer the question "who" is most likely to buy my product or service. Instead of sending marketing materials to every single prospect; companies can narrow the list down to the people most likely to make the purchase. BI developers can also build cubes; and, ultimately develop scorecards so companies can monitor sales progress; or, determine an organizations progress towards meeting established targets. 

Getting Started


Before a BI developer can build scorecards and dashboards; there are preparation steps that must be followed. The developer must for create a business intelligence project to access and prepare the data in the data warehouse. But cubes are not the only power-tool offered through BI. Mining structures and models give access to predictions that can save time and money as well as boost sales. However, Before a mining structure and model or cube can be created the following three tasks must be completed from within SQL Server Business Development Studio; or, a BI project created with Visual Studio 2010 or higher:
  • Create a Data Source: A connection must be made to the database that contains the data to be accessed.
  • Create Data Source View(s): A view of the data, to be accessed, must be created. The Data Source View uses the data source to access the database so developers can select the tables/views that contain the data. If a developer is to use some (not all) of the columns in a table the developer can create a Named Query using the Data Source View. Although the project is Analysis Services, Transact-SQL (T-SQL) is used to build the Named Query because the query directly accesses the database objects. The T-SQL select statement can be used to select the desired table and fields, as shown in the following picture.


Likewise, if a New Named Calculation is created, from the Data Source View, T-SQL expressions are also used.


  • Create Dimension(s): Data that presents meaningful attributes to support a measurable event, within an organization, are modeled in business intelligence as dimensions. Dimensions provide the data that helps companies learn more about itself. For example, a company's purchases are measurable events as are its sales. Details, or attributes, associated with sales might include products, promotions, customers, region, etc. The details, which are the data stored in dimension tables, provide a way for companies to answer questions about  the internal events. For example, the sale of products might lead the company to ask what products brought in the most money? what products aren't selling? If companies spent money on promotions that company may want to know what ads were tied to peaks in sales? A company may even ask who are our top 10 customers? Or, in what region is our product most popular?  Dimension details is what provides the details that gives companies answers to these questions. And, in a Visual Studio 2010 BI project the dimension(s) are defined before mining structures and models or cubes are created.

Mining Structures and Models


Any company that has historical promotional, orders/sales, demographic and other data has a data goldmine. BI developers can create a mining structure that defines the input data for mining models. The mining models can use demographic (such as gender, age, region, marital status, etc.) and other data to identify the makeup of and drivers for customers who have purchased a product or service. This information can then be used to identify the people most likely to buy. The Microsoft SQL Server 2012 Tutorials - Analysis Services Data Mining tutorials provide BI developers a great foundation to learn how to build a business intelligence project and work with mining structures and models.

Through the tutorials the developers use data in the AdventureWorksDW2012 database to build three mining models: the Decision-Tree, Cluster and Naive Bayes. In addition, the tutorial teaches developers to test the accuracy of each model's predictions to identify the most accurate mining model by creating a Mining Accuracy Chart. Developers begin by selecting the models to be compared.


The Lift Chart's property window (bottom right corner in the following picture) displays the Model Name, Score (which conveys the effectiveness of the model), Population Correct  (a value that defines the percentage of population data that is correct) and Predict Probability (a value that tells how accurate the predictions will be).  There are several useful resources that provide additional information on Lift Charts as follows:  http://technet.microsoft.com/en-us/library/ms175428.aspx and http://msdn.microsoft.com/en-us/library/ab77eca1-bd48-4fef-b27f-ff5b648e0501%28v=sql.90%29 . In the following Lift Chart, the TM_Decision_Tree model is closest to the Ideal Model and will, therefore, provide the most accurate predictions regarding who will buy the product (which in this example is a bike).


Once the company has the profile of the persons most likely to buy the product; marketing materials and promotions can be designed for the targeted audience. The following paragraphs provide additional information about Microsoft models used in the above chart.

Decision Tree Model


The Decision Tree and other mining models, used by Microsoft BI tools, apply advanced statistical methods that have been used for years to analyze data. 

The Decision tree model was developed to make predictions. In the following example, the decision tree results originate from an All node for bike buyers (also taken from Microsoft SQL Server 2012 Tutorials - Analysis Services Data Mining). The light blue represents the group that has a 50.59% probability of buying a bike versus the pink group that has a 49.41% probability of not buying a bike (as shown in the properties window in the bottom right corner of the picture below).


The decision tree presents the attributes as nodes that can be expanded or collapsed. From the All root node the decision tree shows bike buyers in four groups of people based on the number (0, 1, 2, 3 and 4), which defines the number of cars owned.


From there users can see the people grouped by income, age, commuting distance, marital status, etc.


Users can mouse over a node to see the number of cases broken down by the light blue (represented by 0), pink (represented as a 1) and cases with missing values (represented as the word missing).


If the drill-down option is selected when the mining model is created; users can select the drill-down option to view the cases associated with a node.


The Dependency Network tab of the Mining Model Viewer provides access to the All Links slider. This view shows all of the factors relevant in predicting whether someone will buy a bike.


Users can move the slider down towards the Strongest Links option to see the factors that that have the most impact on predicting whether someone is or is not a bike buyer. According to the decision tree model (shown below) age, region and number of cars owned are among the strongest influences. Notice, in addition to the predictions the influencing factors also represent information someone is not likely to conclude without a model.


The following paragraphs present additional information on the two other models that were compared to the decision tree model to determine the most accurate model in this scenario.

Microsoft Clustering


The following diagram shows the data modeled using the Clustering algorithm. Notice the clustering mining model presents the same data in a way that looks very different from the decision tree model. The data is grouped into clusters.


The Cluster Profiles view, show below, provides details on how the clusters are divided into the same attributes (income, age, commute distance, etc.) as the decision tree.


Microsoft Naive Bayes


With the Naive Bayes model the user is first presented the Dependency Network tab. The All Links slider is moved to view the influencing factors used to identify bike buyers.


The Naive Bayes model also has an Attribute Profiles view and an Attributes Characteristics view, as shown below. The following view sow the probability based on attributes.


Querying Multidimensional Data


When creating the inputs for a model the BI Developer uses the Mining Model Prediction tab, which is available from the Mining Structure design window. The mining model is built from the mining structure, which uses Multidimensional Expressions (MDX) as shown in the picture below. The Mining Model Prediction window has an option that allows the developer to manually build the MDX query; or, the developer can select the input table(s)/field(s) and the system will build the MDX query.  Follow are a few resources to learn more about MDX:  Basic MDX Query article; Key MDX concepts article: http://technet.microsoft.com/en-us/library/ms144884.aspx; and MDX Reference: http://technet.microsoft.com/en-us/library/ms145506.aspx .

Cubes


While mining models aide in predictions, cubes provide a way for developers to select views or tables that will be used as measures, which are numeric values pulled from a fact table. The developer can then select one or more dimensions (discussed in the beginning of this article) to be associated with the measure. The following picture shows the Internet Sales table selected as the measure. Geography, Customer, Product, DimPromotion are all dimensions associated with the measure.


Once the measures and dimensions are created users can access the cube's Browse tab and select a dimension. From within the Browse tab users can view the dimension data associated with the measure. In the following example the Customer dimension was selected, therefore; the Browse details show sales data for each customer.


SharePoint 2010 PerformancePoint Dashboards


SharePoint 2010 extends the capability of BI cubes. Developers can make use of SharePoint's business intelligence capabilities by creating a SharePoint site collection from the Business Intelligence Center template. SharePoint creates a Business Intelligence site collection that provides a way to manage external connections, create reports, scorecards and dashboards. (The following article provides useful information on the difference between a scorecard and a dashboard:  http://office.microsoft.com/en-us/sharepoint-server-help/what-is-the-difference-between-a-dashboard-and-a-scorecard-HA101772797.aspx)


Developers can use the Dashboard Designer, accessed from within SharePoint, to define color-coded thresholds that reveal values below, above or at business targets (for performance measurement) and perform other tasks.


Scorecards let managers and executives view data, in real-time, to remain abreast of an organization's progress towards reaching established goals. Excel charts (discussed in an upcoming post) and reports can be added to the business intelligence center to build dashboards that can help the entire organization improve customer service, sales, productivity and more (see the following tutorial on balanced scorecards:  http://technet.microsoft.com/en-us/library/hh750382%28v=office.14%29.aspx).


With SharePoint 2010 organizations not only manage documents; but also achieve piece of mind by knowing where a company stands with every aspect of its key business operations. The following link provides access to a tutorial that includes instructions on how to build a dashboard and scorecards:  http://msdn.microsoft.com/en-us/sql10r2byfbi-trainingcourse_sql10r2byfbi08-hol-01.aspx